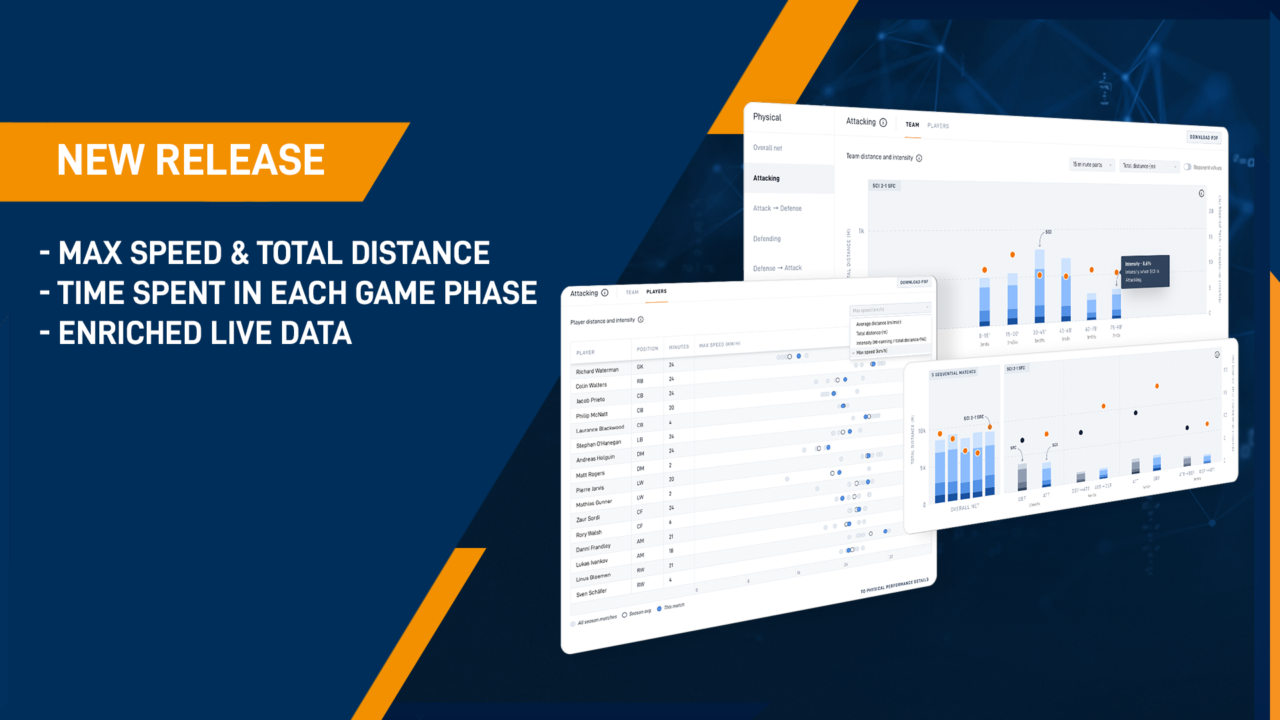
SciSports is delighted to announce upgrades to our Performance Center application, where we have added physical insights for maximum speed, total distance as well as time spent per game phase for both live and post match analysis.
After releasing next-gen insights for Game Phases and League Analysis, the SciSports Performance Center continues to provide academies, senior teams and entire leagues with the ultimate performance analysis tooling for match insights.
Our newest features will allow users to gain even deeper insights across a number of Performance Center elements.
By fully integrating separate data sources into one central platform, the SciSports Performance Center provides data collection, delivery and analysis tools for efficient decision-making.
Our latest update will provide a number of direct benefits for customers. Below, we take a closer look at what they are and how they will lead to enhanced performance analysis.
Max Speed and Total Distance per Game Phase added to Physical Reporting
Users can now analyse the Max. Speed (km/h) and Total distance (m) of their individual players and team, for the four main game phases along with the overall net values.
As shown below, users can navigate to a particular match and game phase, in this case Attack > Defence. Here we can see how a team’s players have performed in terms of Max. Speed during the selected match (highlighted in blue), other matches this season (grey) and the season average (highlighted in white).
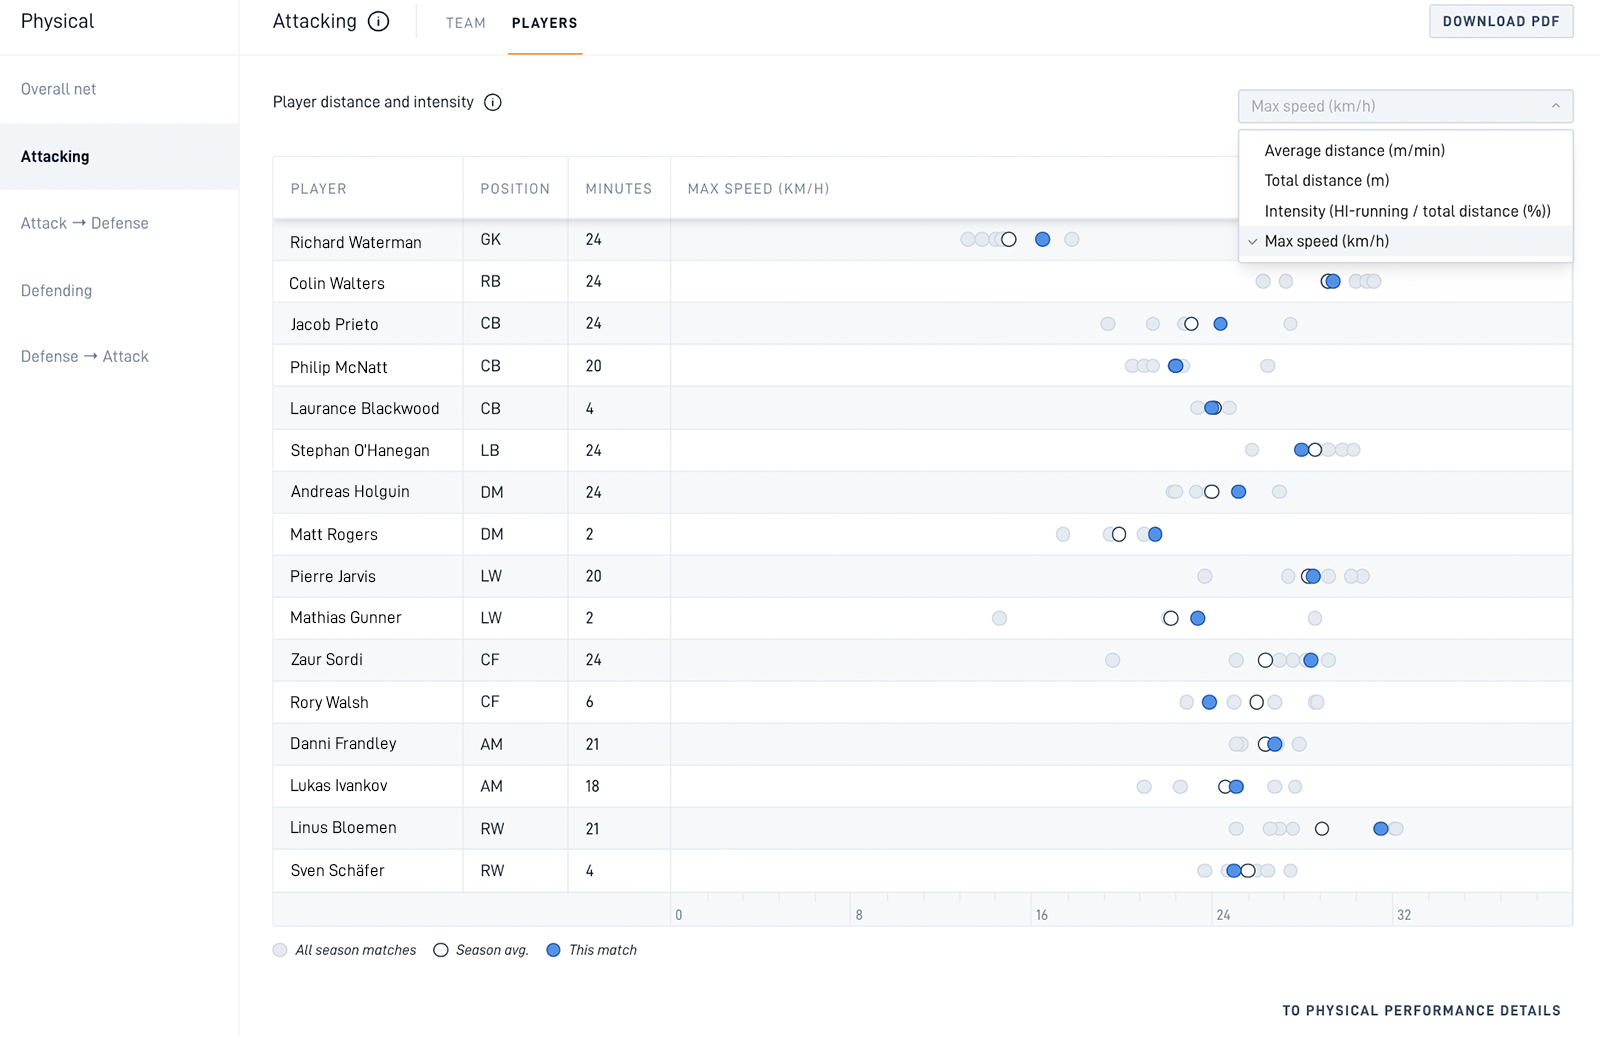
Figure 1. Team A’s players by Max Speed in Attack > Defence can be compared to the opposition
Furthermore, you can also switch between different Game Phases to analyse how each player, or the whole team, performs in different phases.
This additional insight has many use cases, one of which can be opponent analysis. For instance, an opponent’s max speed in attacking transition can be very relevant for analysts, who can make plans to be prepared for counter-attacks.
Within this update we also have added Total Distance (m), which can provide further insight into each player’s workload and effort during the game. These figures can be aggregated and benchmarked on player and team level for further analysis.
Users can switch between metrics to get different actionable information that can be applied within the tactical context of the match.
Addition of Time Spent in each Game Phase
Another update is the ability to view time spent in each Game Phase. As shown in the graph, users can find this below each bar chart, and can be broken down into 45 minute or 15 minute parts.
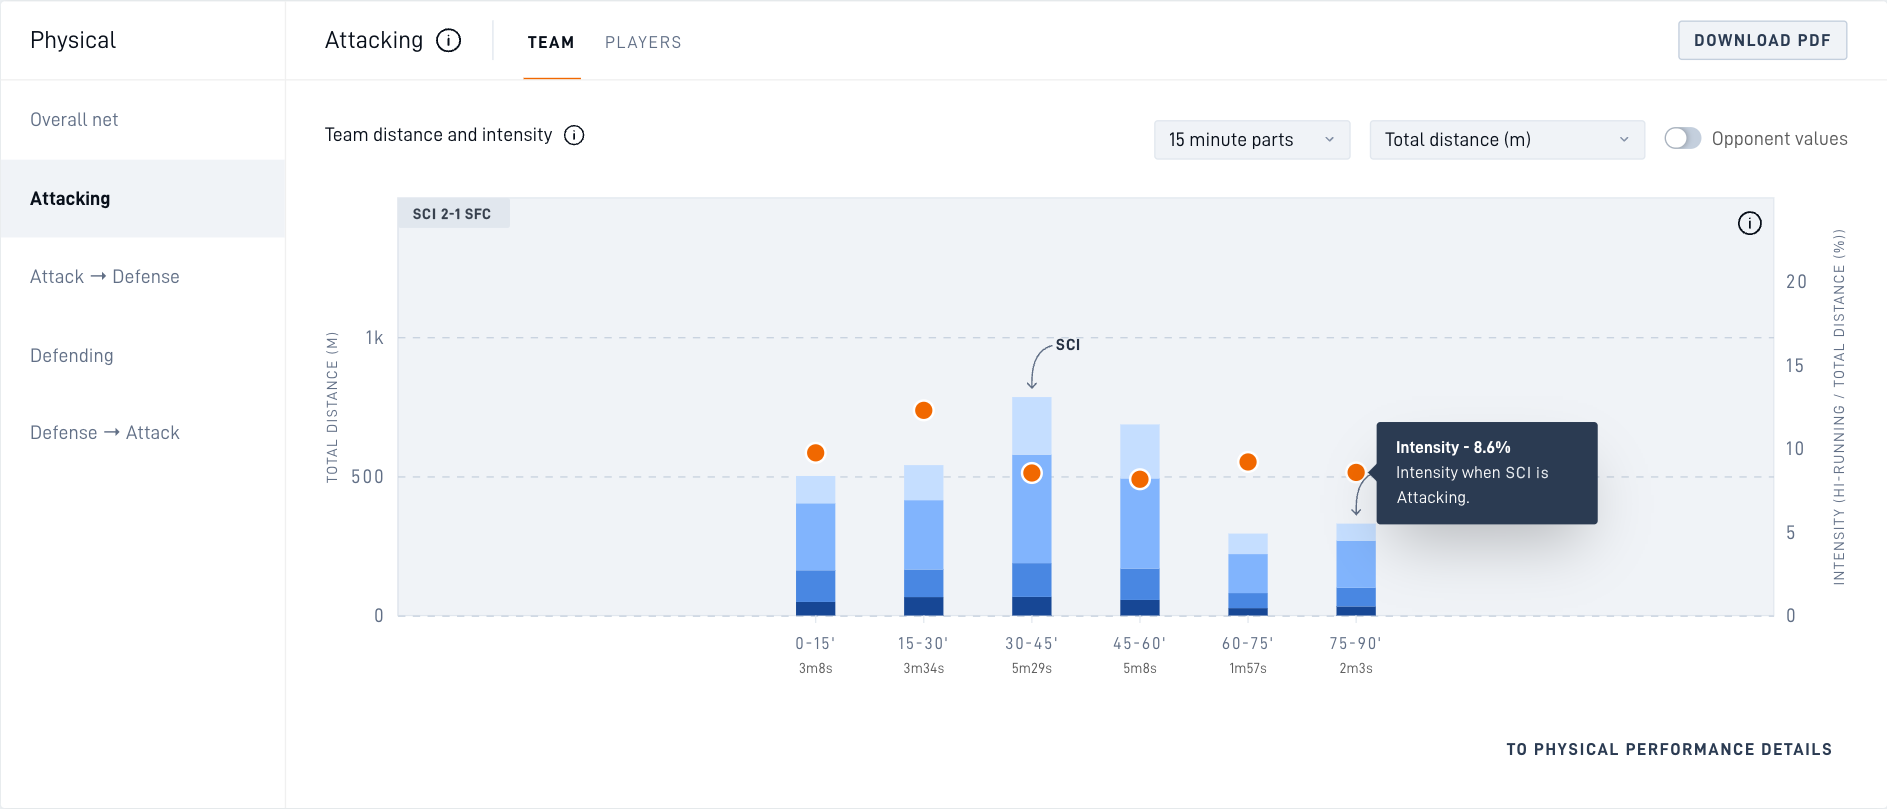
Figure 2. Attacking output of a team showing total distance, intensity and time per game phase
We see how SCI vs SFC played out in terms of team distance and intensity in the Attacking Game Phase and in each 15 minute segment.
Some key takeaways from the above graph are that the team spent most time in the attacking phase in the 15 minute segment just before half time (5m29s), however the intensity during this phase was lower than other segments.
Augmenting the physical output information that was already available with the new Time Spent values for each Game Phase can provide deeper insight and a more holistic view to analyse match performance.
Depending on your use case, the Time Spent values can be valuable to analysing a match. For example, analysts can use this to find patterns such as identifying times when a team’s intensity in a particular game phase drops, so as to use this information to their advantage.
Enriched live data coverage
Within the live analysis section, users can now also monitor the above updates in real time.
This unique feature enables users to be proactive during the game by using real-time physical load indicators in the tactical context of the match, giving them a powerful winning-edge.
By being able to actively monitor metrics such as Total Distance (m), performance staff will have objective information at their fingertips to make in-game tactical changes.
For instance, values from the physical report can be used to benchmark individual players and can support in-match decision making such as substitutions based on the player’s physical load.
Analyse your team’s performance data with SciSports
Are you working in professional youth or senior football and are interested in our performance analysis solutions? Get in touch for a demo.