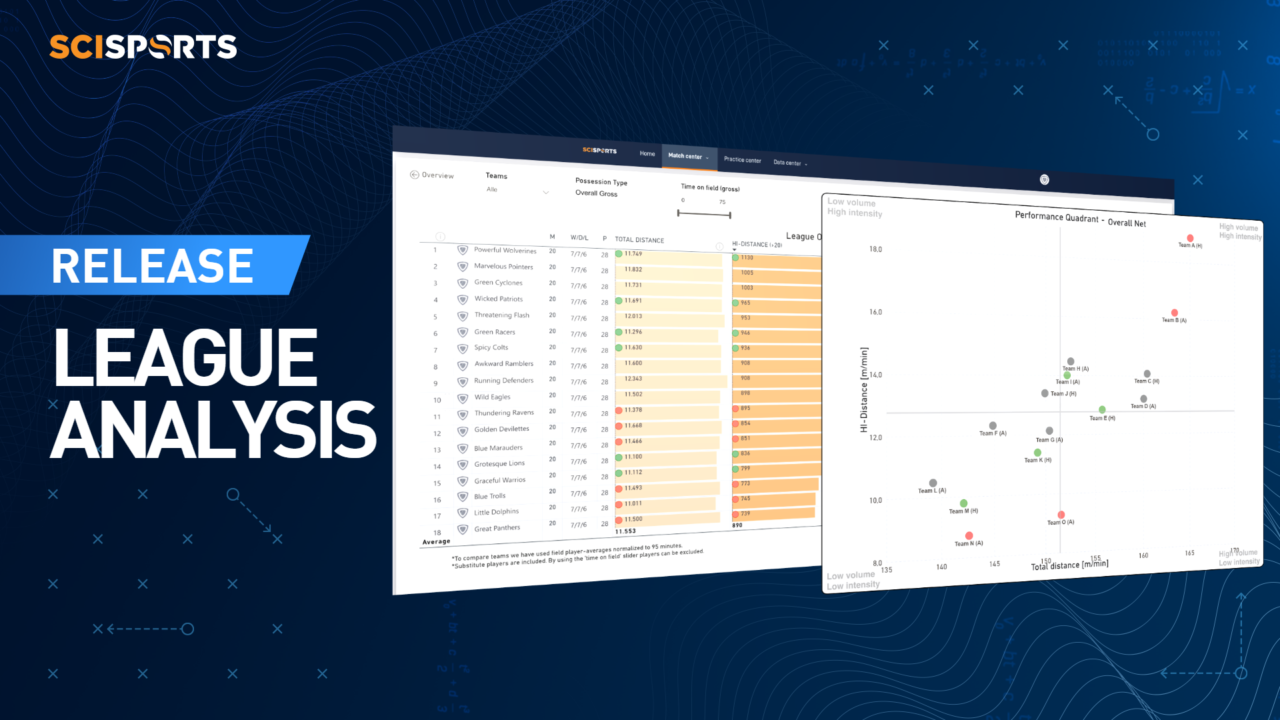
SciSports is delighted to introduce more added functionalities within its Performance Center application, bringing value performance insights through League Analysis.
The SciSports Performance Center provides clubs and leagues with the ultimate performance analysis tooling for both pre and post-match insights. For analysts preparing post-match evaluations or preparation for an upcoming match, features include a comprehensive view in terms of physical and tactical data.
By supporting clubs all around the world to provide performance analysis solutions, SciSports is able to bring data-driven insights to a variety of leagues. Through direct analysis of individual 15-minute periods of matches, analysts can directly view their team’s performance and place that within the context of the match itself in a balanced way.
In this post, we walk through the League Analysis feature within the SciSports Performance Center and demonstrate how it directly leads to expert performance analysis in professional football.
What is League Analysis in the SciSports Performance Center?
The League Analysis feature provides users with the tooling to combine physical and tactical performance data into one comprehensive view. Through combining both elements of performance analysis, users can ultimately examine their club’s performance in a contextualised manner.
In the following five elements, users can analyse their team’s performance in granular detail of not only their own team but also upcoming opponents and the entire league.
- Physical team ranking: provides a ranking of the physical performance of all teams.
- Team performance comparison: a quick insight into the physical performance of your team compared with the other teams in the league.
- Contextualized performance analysis over time: contextualised performance data over time.
- League overview: compare the physical performance of a team between all matches in a quadrant view.
- Player Position analysis: compare the physical performance between player positions and team formations.
The combination of all five functionalities allows users to have a full picture of their team’s physical and tactical performance. In particular, the opportunity to compare physical performance data against other teams and matches throughout the season enables noteworthy comparisons to eventually improve performance on the pitch.
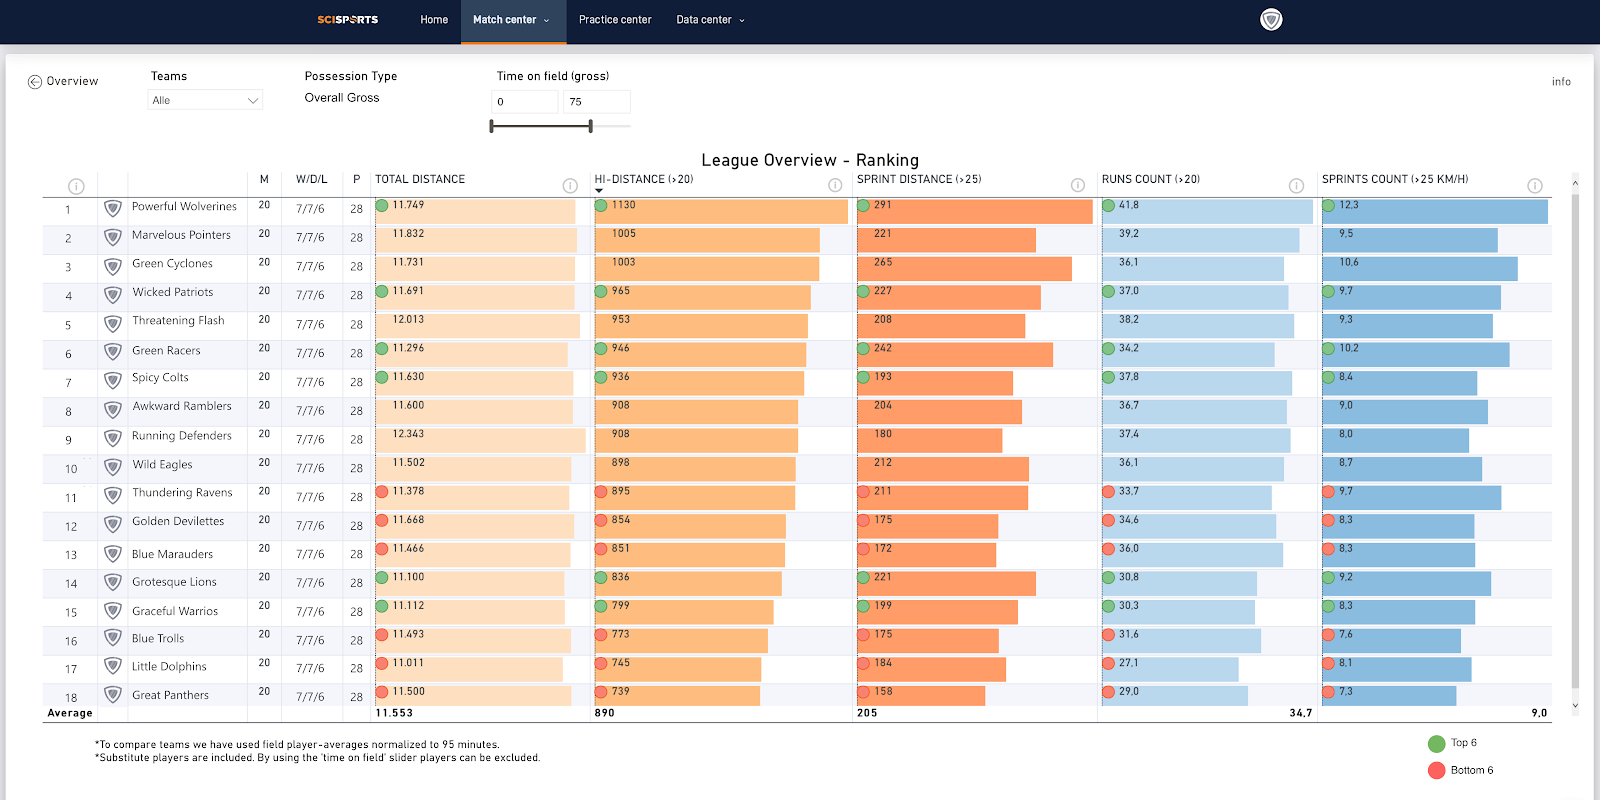
Figure 1. Ranking all teams across the league based on performance KPIs
What we see in the above view is the League Ranking table to identify KPIs within performance data. Comparing different aspects of running data can help to contextualise a team’s style of play and ultimate performance on the pitch. However, further insights can also be produced to help draw further comparisons to feedback to coaching staff, for example.
As we explain below, a range of different insights can be drawn from the League Analysis functionalities.
What insights can be taken?
All four aspects of the League Analysis feature essentially allow users to accurately benchmark against other teams in the league. Ranking on physical variables such as total distance, sprint count and other factors – as shown above – can be useful for a quick overview of how a team ranks in the league. Providing direct context in different game phases ultimately gives users the opportunity to find strengths and weaknesses in upcoming opponents, for example.
To delve deeper, users may want to analyse any specific trends within their team or upcoming opponent’s performance data. For example, the visual below presents users with information on the selected team’s average performance output against each league opponent.
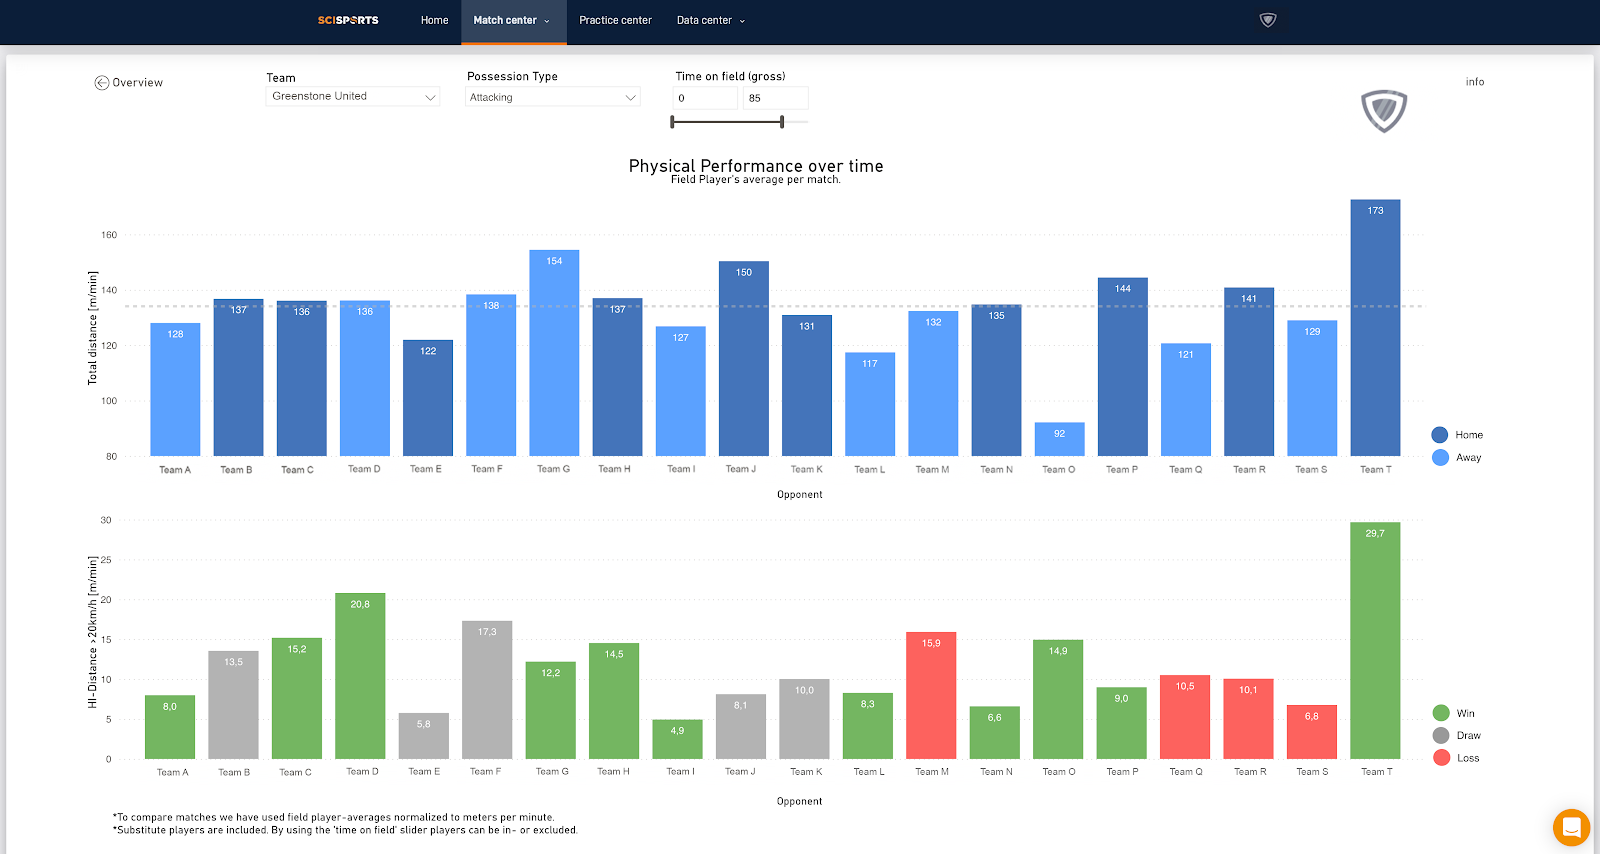
Figure 2. Contextualising a team’s physical performance over time
What this primarily does is creates a clear overview for users wanting to pick out areas of high and low performance in terms of total and HI-distance. In combination with knowledge on the end result of matches and the opponent’s playing style, meaningful insights can begin to be drawn.
Analysing in further depth on match, player and season level makes sure that users have the option to delve into as much detail as required. In the following section, we explain how benchmarking in these three ways can be particularly useful for performance analysis.
How useful are benchmarks for League Analysis?
As already explained, an overview of how your team, upcoming opponent or even entire league performs in terms of performance data can be useful. However, being able to benchmark these insights against one another is an incredibly valuable tool.
While users can utilise the League Analysis functionalities for a range of purposes, benchmarks often provide a clear focus for match evaluation. In the graphic below, users are able to directly compare their team’s total and HI-distance totals against individual matches they have played throughout the season. From here, users can begin to analyse why their team earned the result they did.
Figure 3. A direct comparison of performance data per match
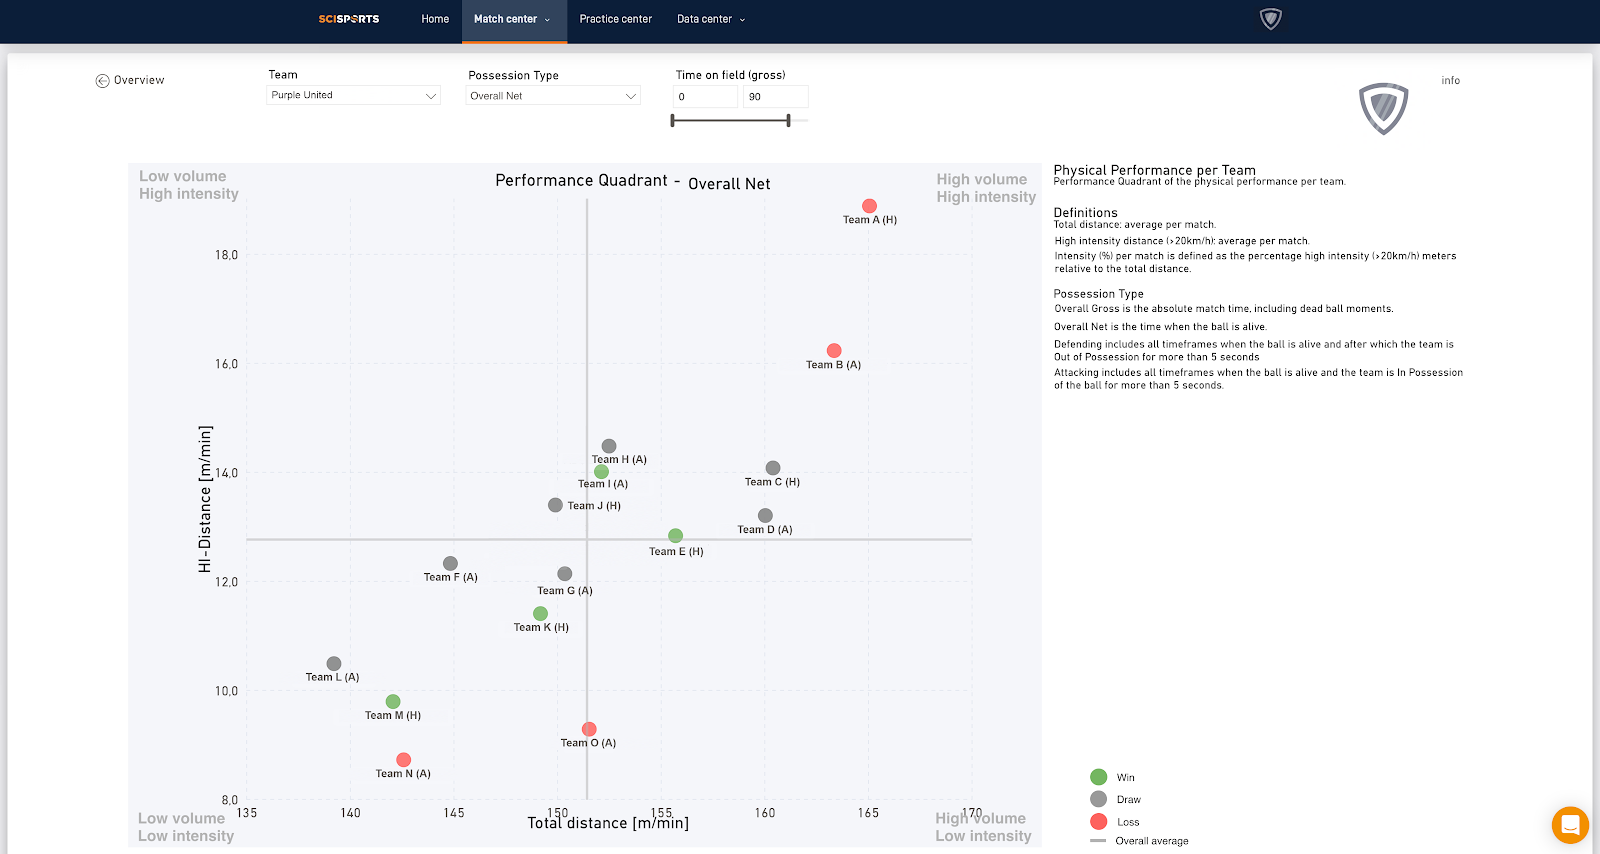
This type of analysis can be developed further into looking closely at team level. In the example below, each team in the league is directly compared in terms of total and HI-distance running totals. This ultimately begins to provide an overview of elements such as style of play and overall team performance, when also contextualising league position by colour. Using this functionality directly shows you where the physical performance of your team stands compared to the other teams in the league.
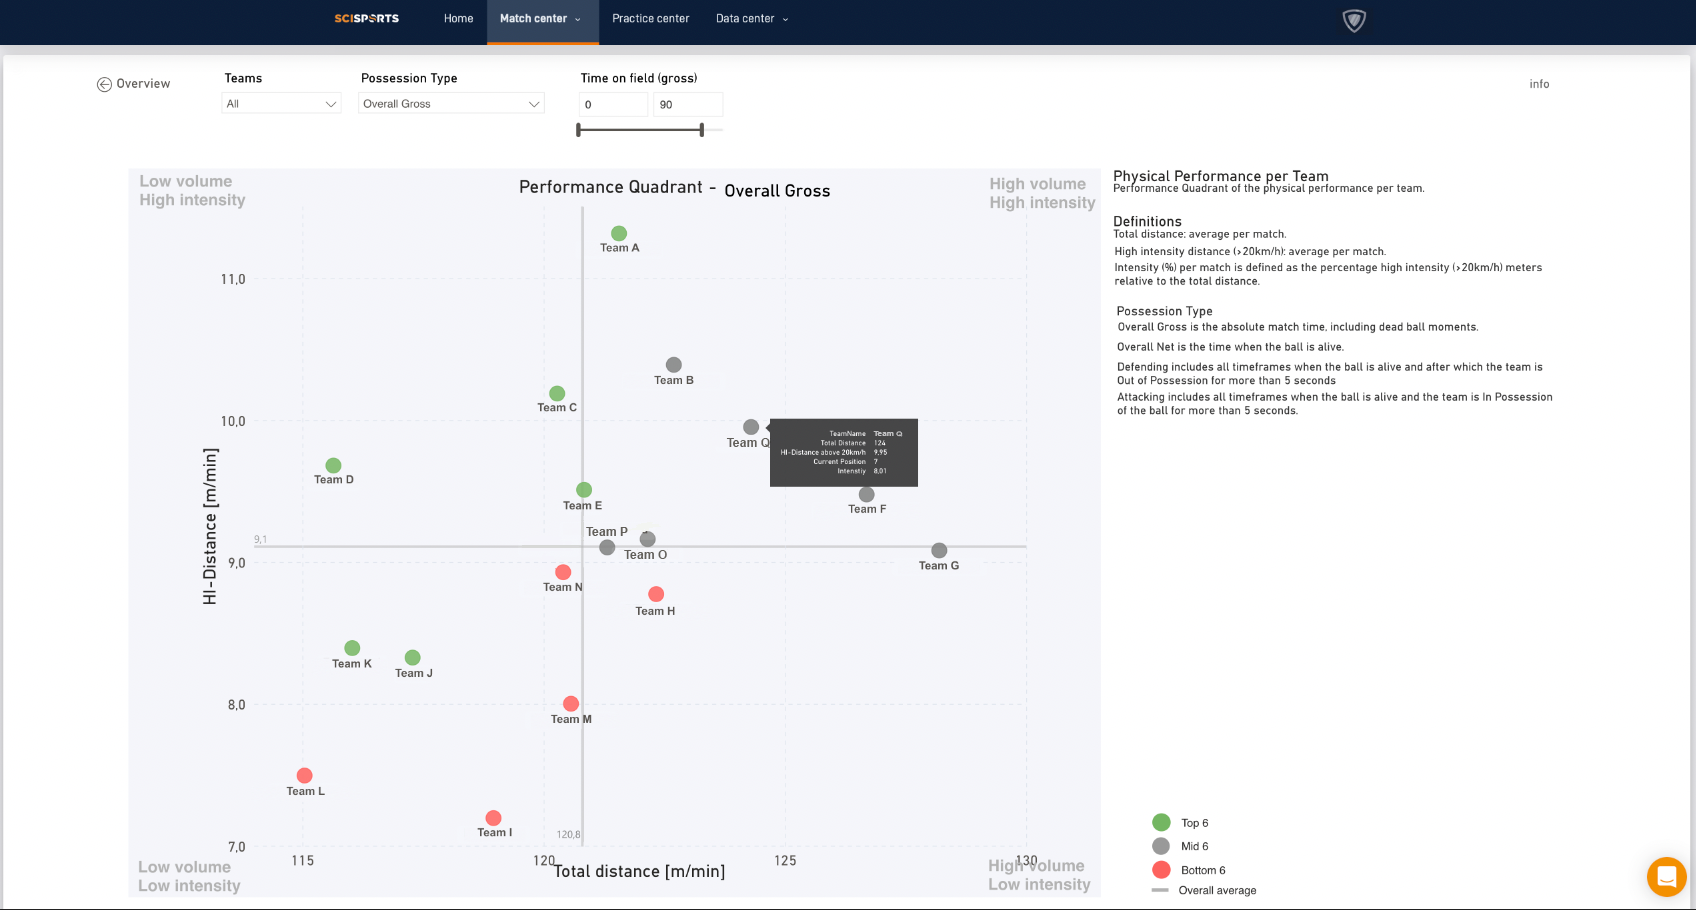
Figure 4. Direct comparison of each team’s performance data
Another way in which this information can be used is through direct analysis of players and teams in certain positions and formations. Analysing what is required of a central midfielder in a low block 4-4-2 compared to a high pressing 4-3-3 may seem straightforward, but having the raw numbers to evaluate this can be a valuable tool for looking at performance.
In the view below, users are able to select a range of functionalities including team, position and formation. All of which provides a good overview on how players are performing in relation to their tactical demands.
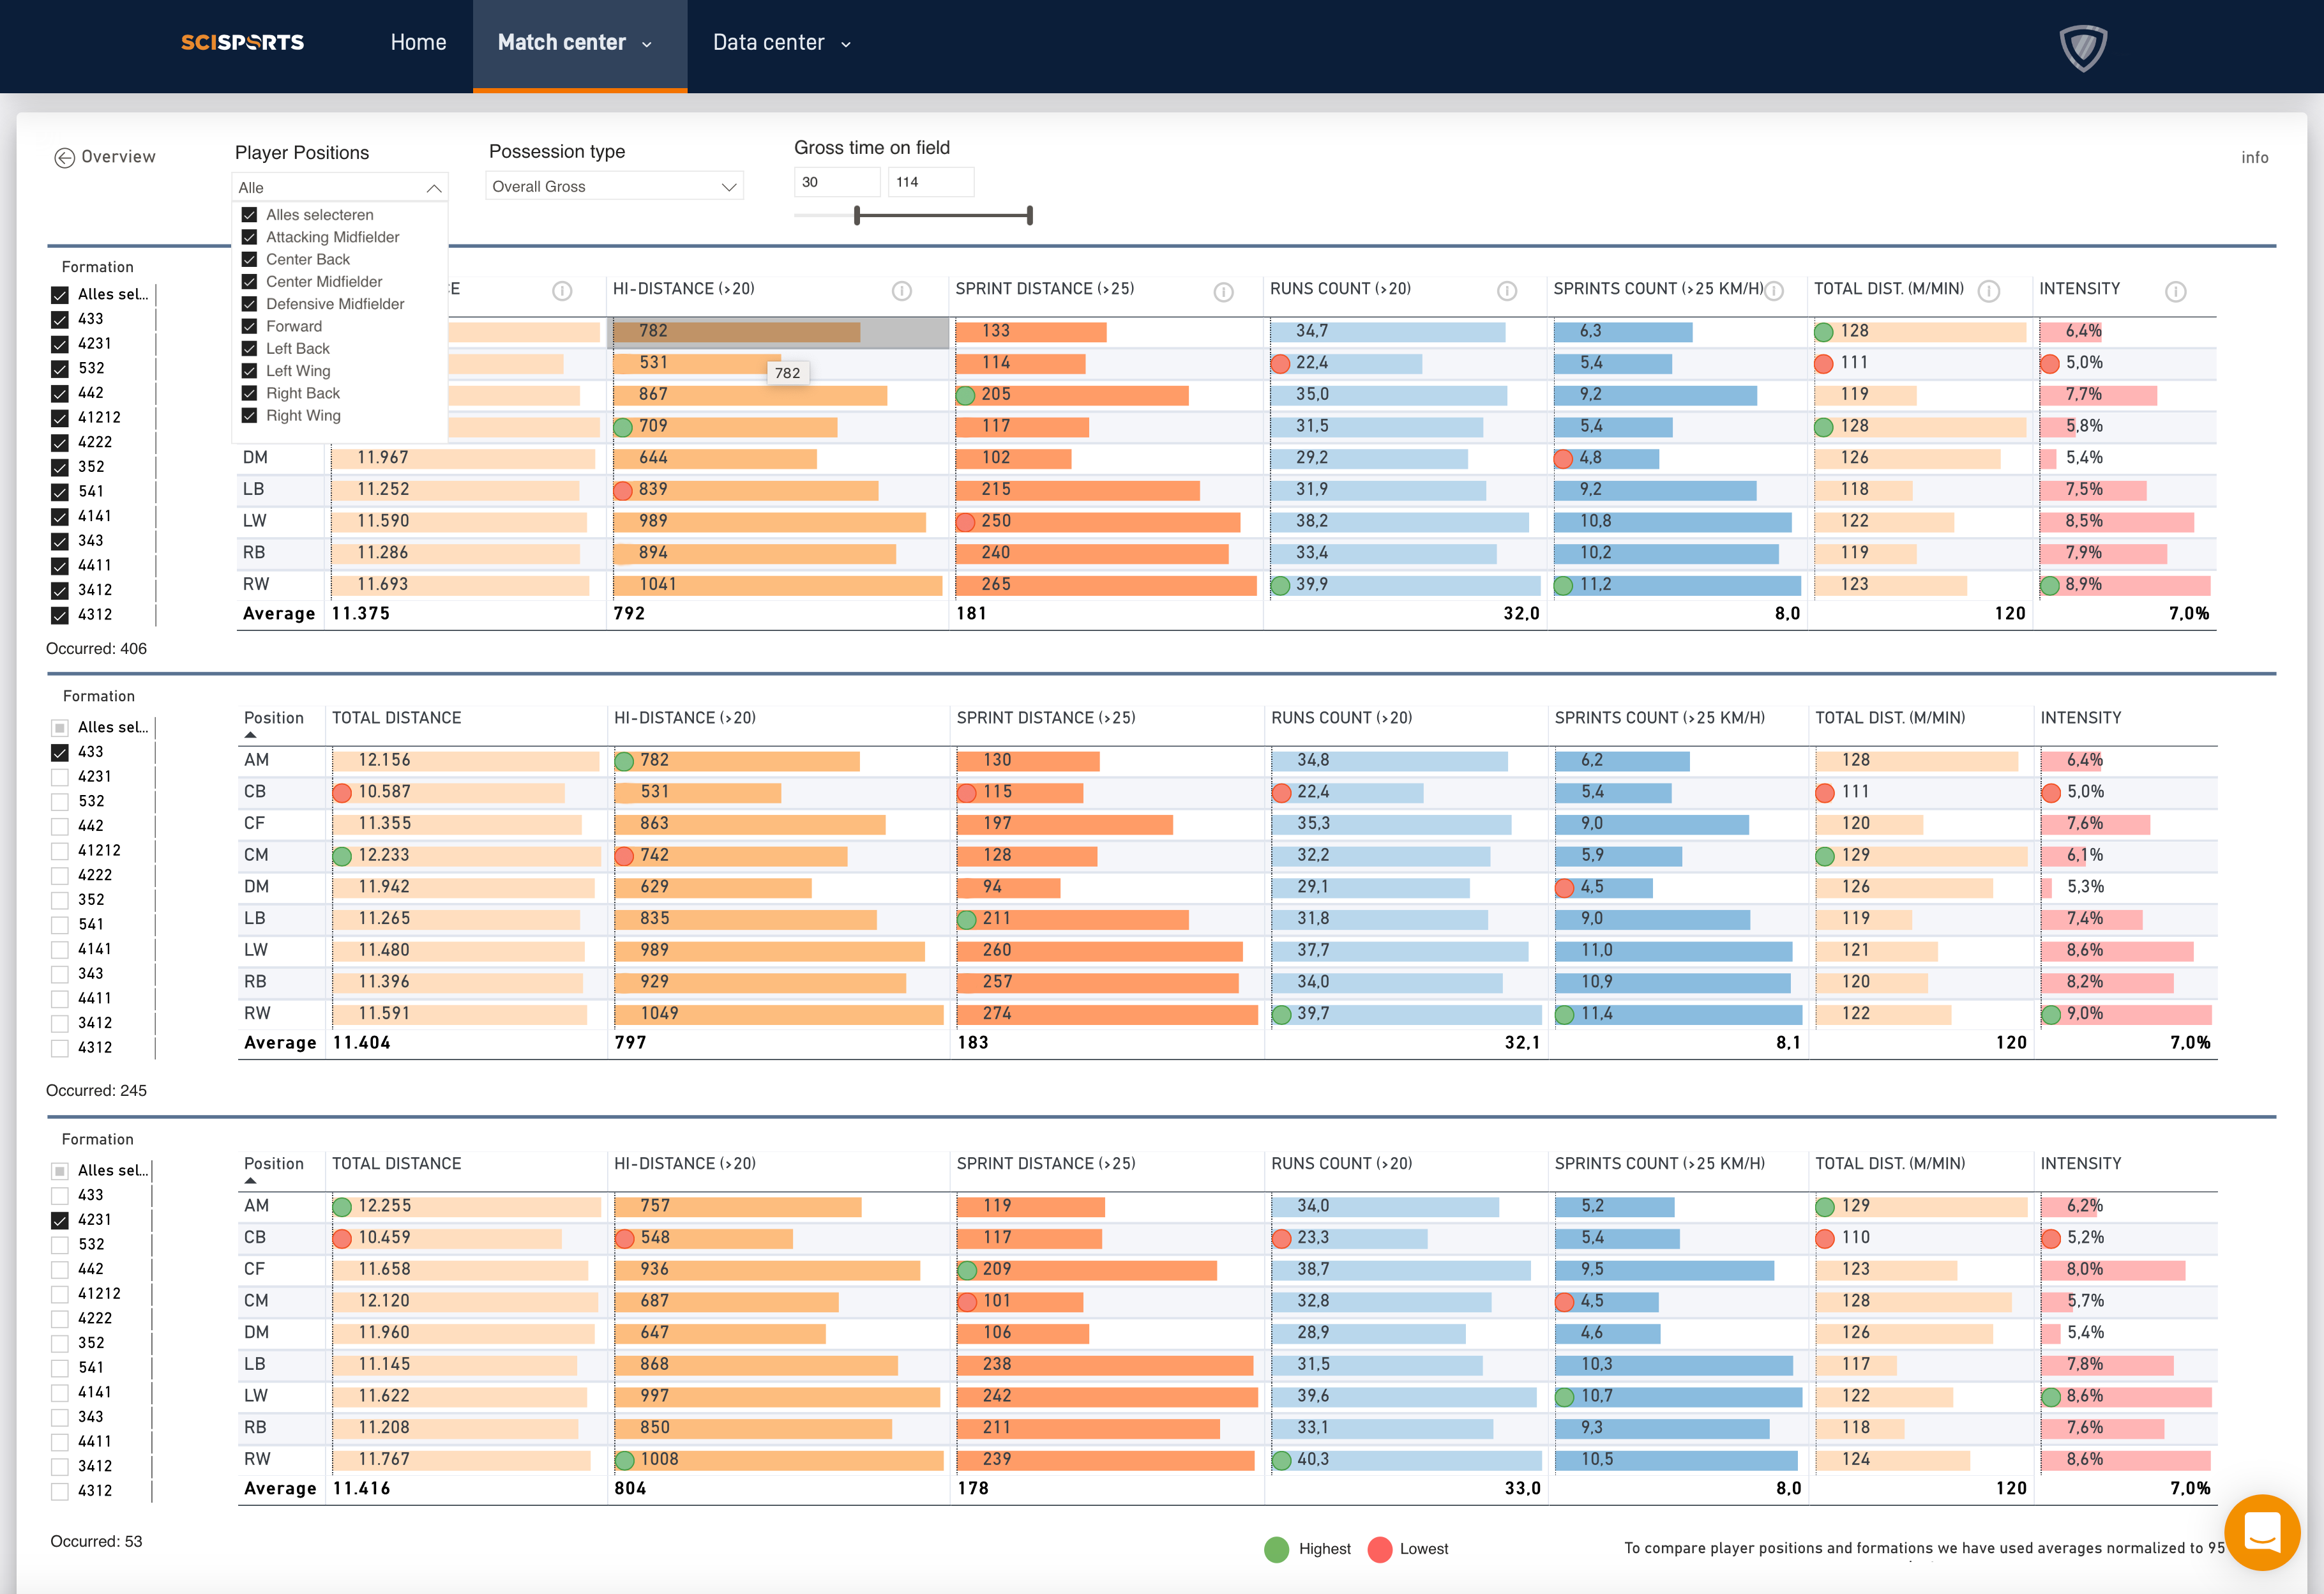
Figure 5. Users can directly view performance data per position and formation
Comparing the physical performance between player positions and team formations can add valuable insight for analysts. This allows users to compare players with benchmarks based on position, formation and league specific demands. As with other features, it has the ultimate aim of adding the most relevant context to performance analysis for the full picture.
In summary, all of these functionalities provide users with the opportunity to view performance data in an interactive and engaging way. The use of data-driven insights across multiple views allows for valuable benchmarking against other teams in the league and ultimately saves time for performance analysts pre and post-match.
Users can create customisable insights on physical performance over time with additional filtering on game phase and substitute players. Therefore answering questions such as: How does my team develop over time? Which matches are the most demanding? What are differences in game demands between home/away or won/draw/lost matches?
The combination of physical and tactical data further ensures contextualised analysis that can be relayed to coaching staff or players. Through the use of the League Analysis feature, alongside a whole range of other possibilities in the SciSports Performance Center, clubs are able to take their performance analysis to the next level.
Find out more about our match-winning performance analysis insights
Working in the professional football industry and want to find out more? Get in touch below!

