SciSports is pleased to introduce new features within its Performance Center application, including Game Phases and Insights which bring new data-driven solutions to life.
The SciSports Performance Center provides clubs with the ultimate performance analysis tooling for both pre and post-match insights. For analysts preparing post-match evaluations or preparation for an upcoming match, features include a comprehensive view in terms of physical and tactical data.
By supporting clubs all around the world to provide performance analysis solutions, SciSports is able to bring proven match-winning insights to a variety of leagues. Through direct analysis of individual 15-minute periods of matches, analysts can directly view their team’s performance and place that within the context of the match itself in a balanced way.
In this post, we take a closer look at how the new Game Phases feature empowers both physical and tactical performance analysis in the SciSports Performance Center.
What are Game Phases and how do they help performance analysis?
The intuition behind the Game Phases feature is to be able to combine both physical and tactical analysis when analysing team performance. Using two different elements of performance analysis in this way is able to produce unique data-driven insights for performance analysts. Based on a club or league’s owned tracking data, this data provider agnostic performance analysis solution enhances the decision-making processes for technical staff.
Overall, the different Game Phases are split into five parts:
- Overall net
- Attacking
- Defending
- Attacking to defending
- Defending to attacking
Providing insights on all phases of a match ensures that there is a complete overview for match analysis within a club’s analysis department. Particular focus on different phases may vary between clubs but a comprehensive summary allows for personalised use based on areas of interest.
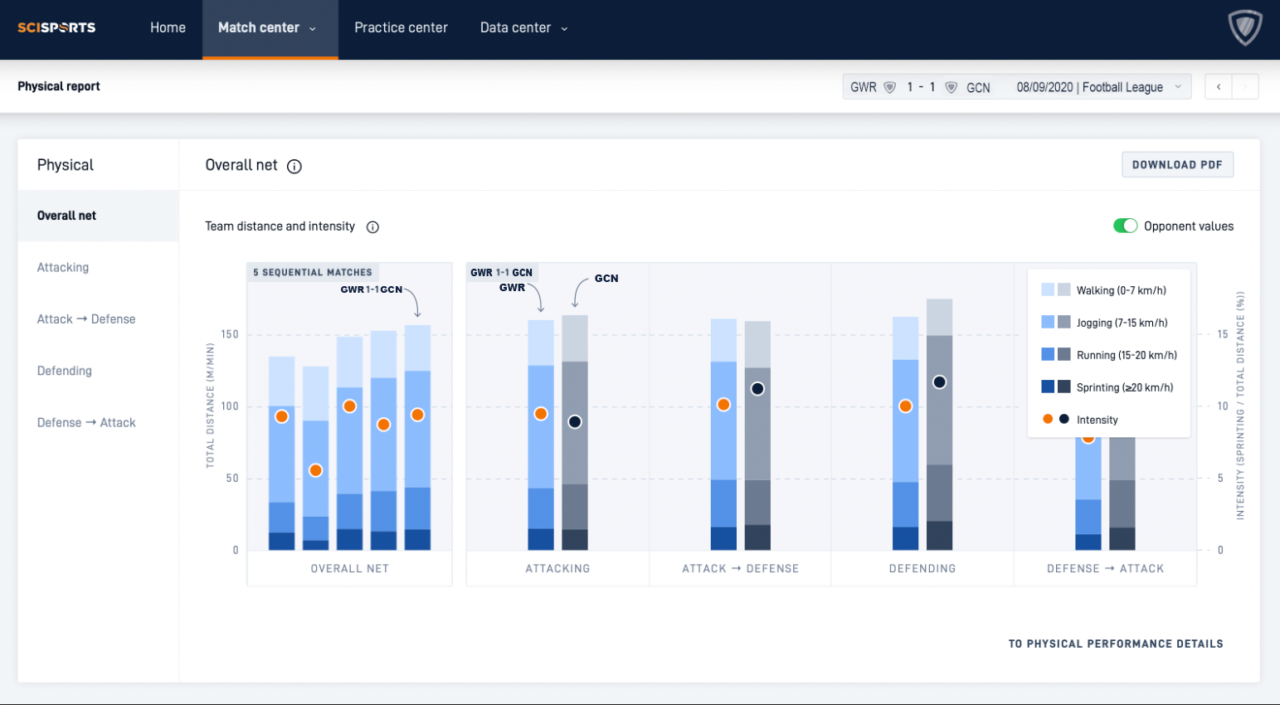
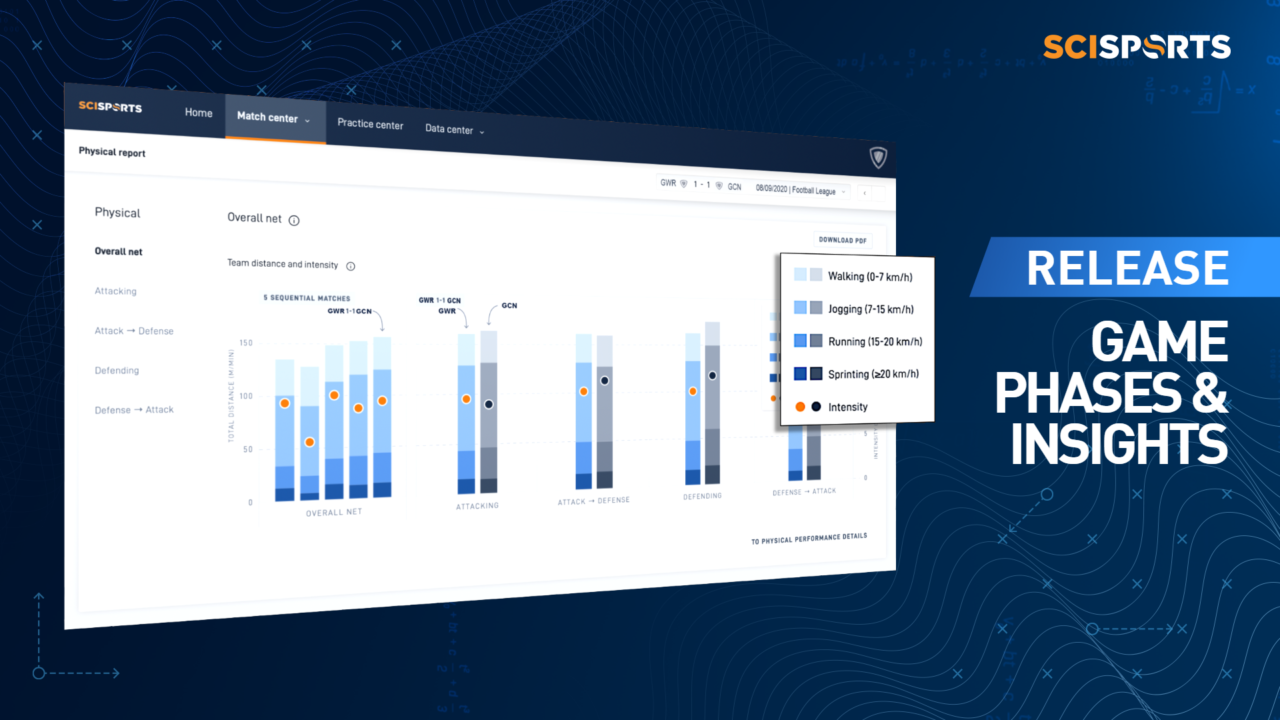
Figure 1. Users can directly analyse physical performance data in game phases
The option to produce trend analysis across the last five league matches further contextualises the physical and tactical performance of the analyst’s club and any upcoming opponents, benchmarked directly against their performance. As you can see in the visualisation above and below, there are different colour shades to indicate the different types of runs/sprints:
- Walking
- Jogging
- Running
- Sprinting
- Intensity
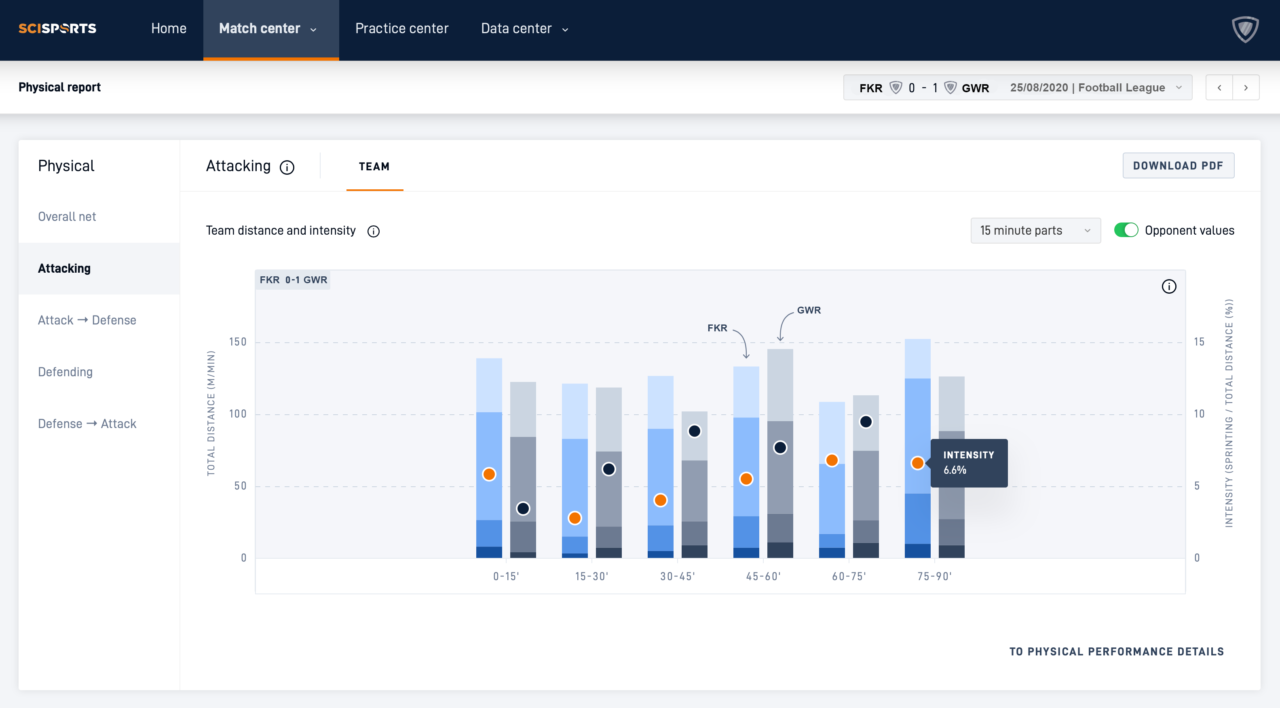
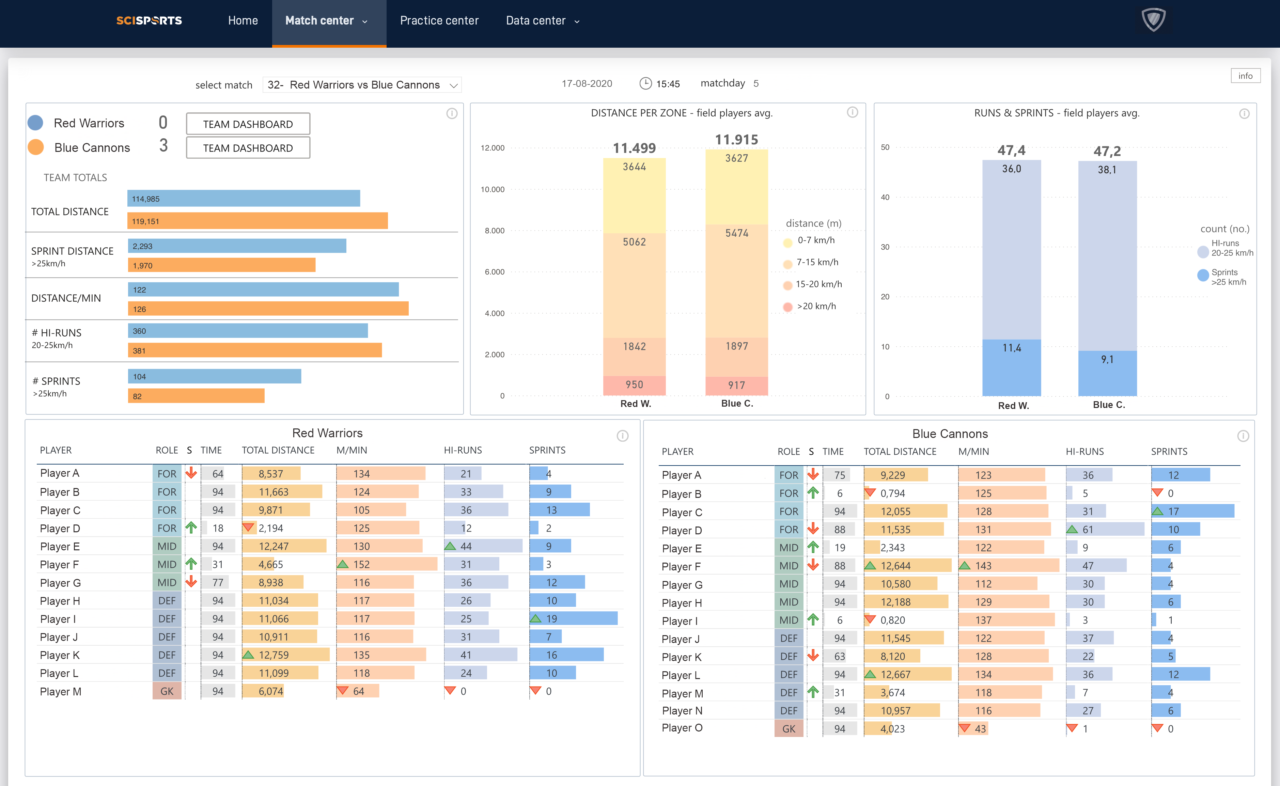
Figure 2. Direct analysis through 15-minute periods of individual matches
This type of view allows for a deeper level analysis at team level. From here, analysts can begin to compare similarities and differences in performance while subsequently viewing the match data in a contextualized way.
Figure 3. Users can also view performance data in a detailed view
In the above view, users are presented with a far greater level of information than in the Game Phases feature. While the Game Phases tab enables a quick and easy summary of how the team is performing in a tactical context.
Why introduce the Game Phases feature?
As already mentioned, the Game Phases feature allows for physical performance analysis in a contextualized way. One of the most important ways for this feature to add tactical context is through viewing physical performance in different parts of a match. For instance, viewing the ‘defence to attack’ tab provides direct insights into how both teams compare in the intensity of their transition from defensive to offensive phases of play.
Introducing this level of analysis gives users a comprehensive grounding in the physical performance of their team and, or, opponent. For instance, users could choose to analyse the physical performance of their team in relation to the game state throughout the 90 minutes. Finding differences in each category across the 15-minute periods can provide vital evidence to support post-match analysis practices.
Overall, such a feature is highly adaptable based on the user’s objectives while also giving an initial level of understanding no matter what each club may be looking for in terms of physical performance analysis.
What value does it directly add for users?
Just like any sort of tooling, the value for users really comes from how they apply it to their individual workflows and respective club situations. In terms of directly applying the Game Phases feature to performance analysis, the main functionality is being able to view physical data within a tactical context.
By being able to view physical data in a game relevant context, analysts can answer important questions they have themselves or indeed get from the coaching staff post-match. Viewing the team’s intensity in 15-minute time periods can address concerns of starting slow in matches or even showing an upcoming opponent who has recently finished strong in games.
Analyse your team’s performance data with SciSports!
Are you interested in our performance analysis solutions? Get in touch with us by clicking on the button below

