
Due to the low-scoring nature of football, the result of a match usually does not tell its entire story. A mistake from the goalkeeper or a questionable penalty call from the referee can mean the difference between winning or losing the game. To better understand the performances of the teams in a match, we developed a deep learning model that estimates the win probabilities for both teams based on the course of events in the match.
In the past few years, several football metrics have been proposed to quantify the performances of players and teams in matches. These performance metrics enable to investigate whether a team won a match because they outperformed their opponents or because they were lucky. The most prevalent performance metric is the expected-goals value for chances, which reflects each chance’s probability of yielding a goal. As a result, the conventional approach to obtain the most likely match outcome is to sum the expected goals values for the chances by each team. For instance, we expect a team that creates chances with expected-goals values of 0.2, 0.1, 0.3, 0.4, 0.1, 0.2 and 0.3 to score 1.6 goals. Assuming the number of goals scored by each team follows a Poisson distribution and using each team’s expected-goals tally as the expected value in a Skellam distribution, we obtain the probabilities of a home win, away win, and draw as well as the most likely outcome for a given match. However, this conventional approach considers each shot in isolation and thus completely ignores the course of events in the match. That is, the exact same expected-goals tally could as well be obtained with either fewer chances having higher expected-goals values or more chances having lower expected-goals values.
To overcome the limitations of the conventional approach to estimate post-match outcome probabilities, we propose a deep learning approach that explicitly models the temporal relationships between the chances. Instead of summing the expected goals values, we feed the timestamp and expected goals value for each individual chance into a recurrent neural network model that is capable of capturing the temporal relationships between the chances. In addition, we feed a number of other relevant factors for each team, including the possession percentage, the total number of chances, the total number of fouls, and the pre-game betting odds from the bookmakers, into the model. In the remainder of this blog post, we describe our deep learning approach in more detail. Furthermore, we demonstrate how our post-match outcome probabilities can be used to assemble an alternative league table that considers expected points rather than actual points. This alternative league table can assist directors, managers and bettors with taking better-informed decisions.
Approach
Our approach to obtaining post-match outcome probabilities for a match consists of two steps. In the first step, we use the SciSports’ expected-goals model to compute the expected-goals value for each chance in the match. In the second step, we feed both the computed expected-goals values and their timestamps as well as a number of summary statistics into a deep neural network that outputs the probability of a home win, away win and draw. We employ a neural network to leverage the full wealth of information that is available. With further details on our expected-goals model available in this earlier blog post, the remainder of this section focuses on the second step in the whole process.
We present a deep neural network that consists of a recurrent layer as well as three fully-connected layers. We feed the expected-goals values and their timestamps for each of both teams in a Long Short-Term Memory (LSTM) layer consisting of 30 neurons. Since the number of chances varies from one team to another and from one match to another, we pre-pad and truncate the sequences after 39 chances, which is the highest number of chances for one team in a match we observed in our training data. We combine the output of the LSTM layer with a number of statistics and other relevant factors in a dense layer consisting of 64 neurons, which is followed by two more dense layers consisting of 32 and 16 neurons, respectively. The output layer consists of three neurons, each representing one of the probability of a home win, an away win or a draw. To avoid overfitting, we use drop-out after each of the dense layers. We use a Rectified Linear Unit (ReLU) as the activation function for the dense layers and a Softmax activation function for the output layer, which forces the outcome probabilities to sum to one. Figure 1 shows the architecture of our deep neural network, which has 10,595 trainable parameters.
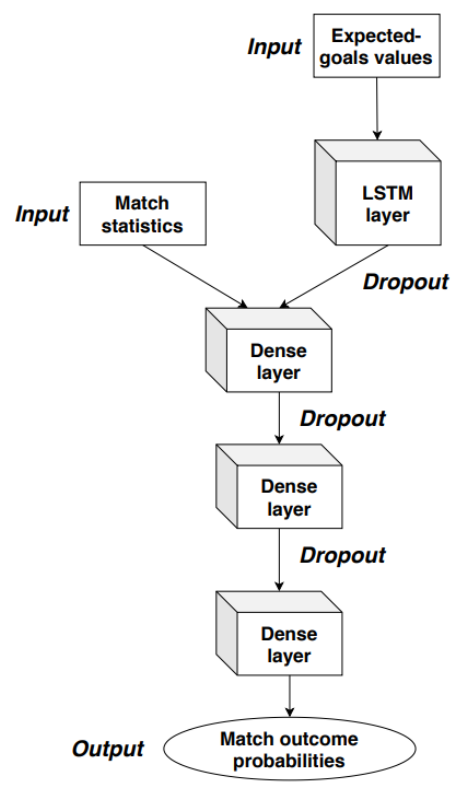
Figure 1. Architecture of our deep neural network to obtain post-match outcome probabilities.
We model the neural network in Keras and train our model on data for over 6,500 matches in the 2016-2017 through 2018-2019 seasons in seven different competitions: the English Premier league, German 1. Bundesliga, Spanish LaLiga, French Ligue 1, Italian Serie A, Dutch Eredivisie and Belgian Pro League. Our experimental evaluation shows that the probabilities are well-calibrated and that our model outperforms several baseline models in terms of logarithmic loss and AUC-ROC. In particular, we compare our model to the implied probabilities from betting odds as well as the conventional approach of summing the expected-goals values for chances amongst others. In the latter approach, we assume that the number of goals that each team scores follows a Poisson distribution and use the sum of the expected-goals values as the expected value for the Poisson distribution. Adopting the Dixon and Coles (1997) approach, we obtain the win, draw and loss probabilities for each team.
Use cases
Using our post-match outcome probability model, we compute the expected number of points for each team in each match. Since a team earns three points for a win and one point for a draw, we obtain the team’s number of expected points by summing their probability of winning multiplied by three points and their probability of drawing. For example, a team having a post-match win probability of 63% and a post-match draw probability of 19%, is expected to earn 2.08 points (= 0.63 * 3 points + 0.19 * 1 point) from the match. Intuitively, this result means that if the exact same match was played multiple times, the team would earn 2.08 points on average.
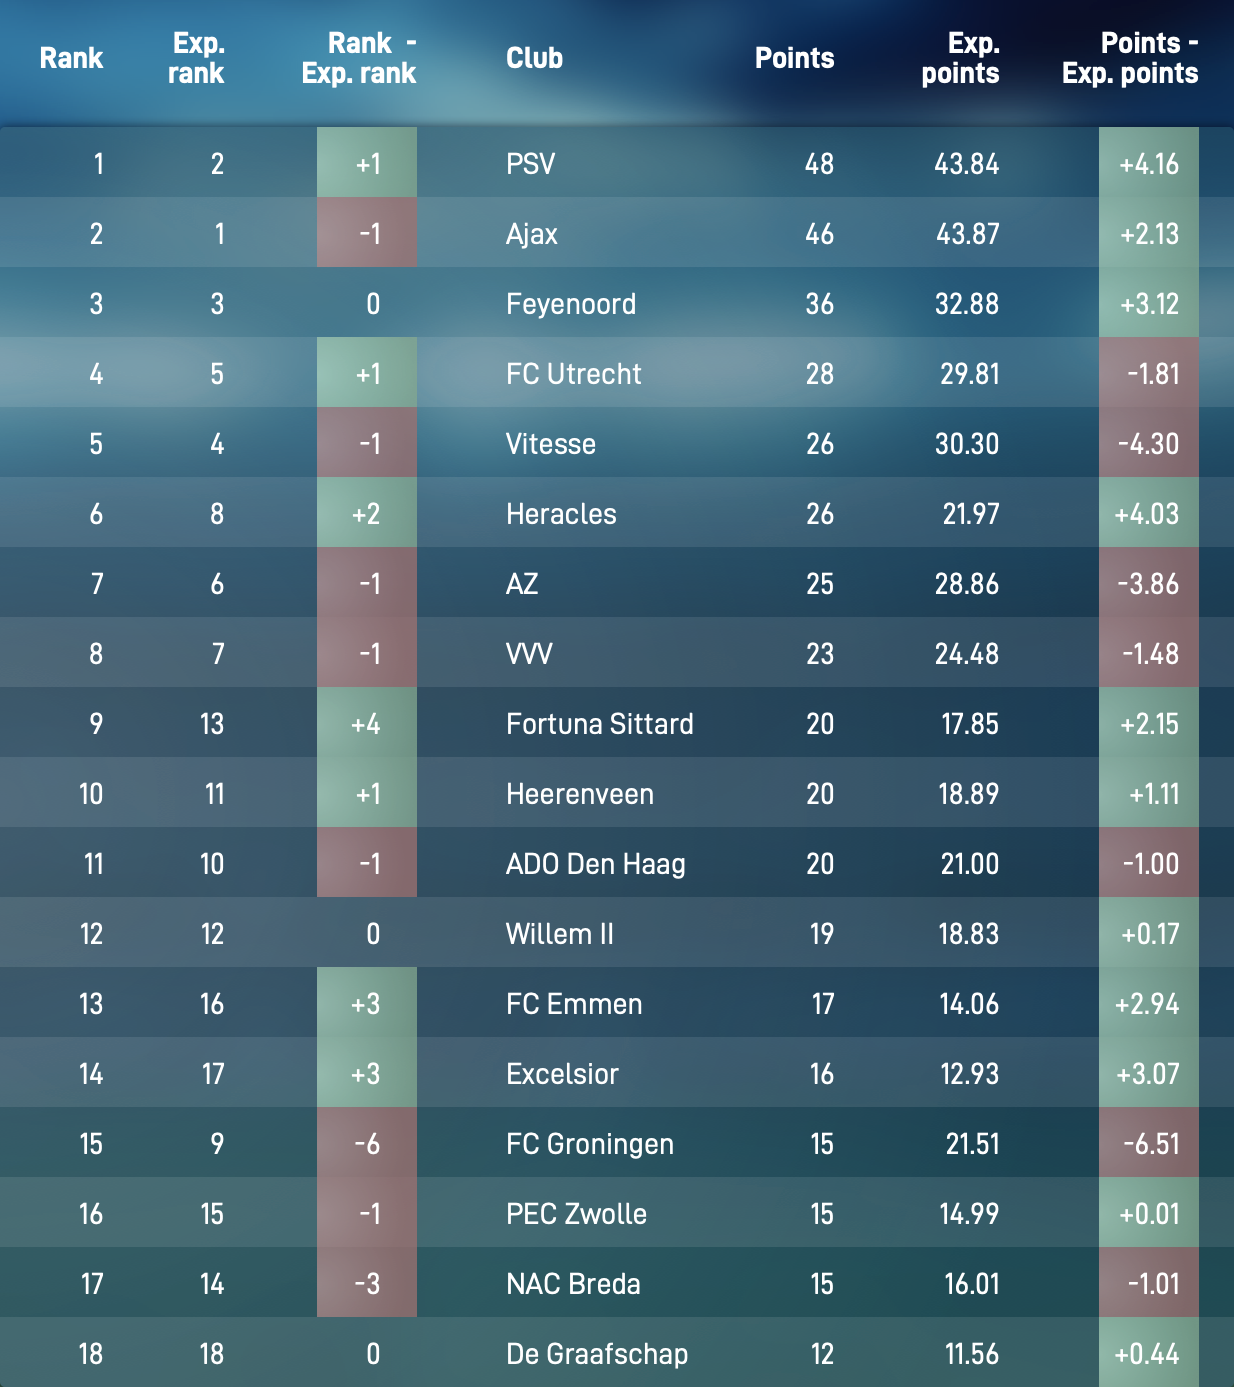
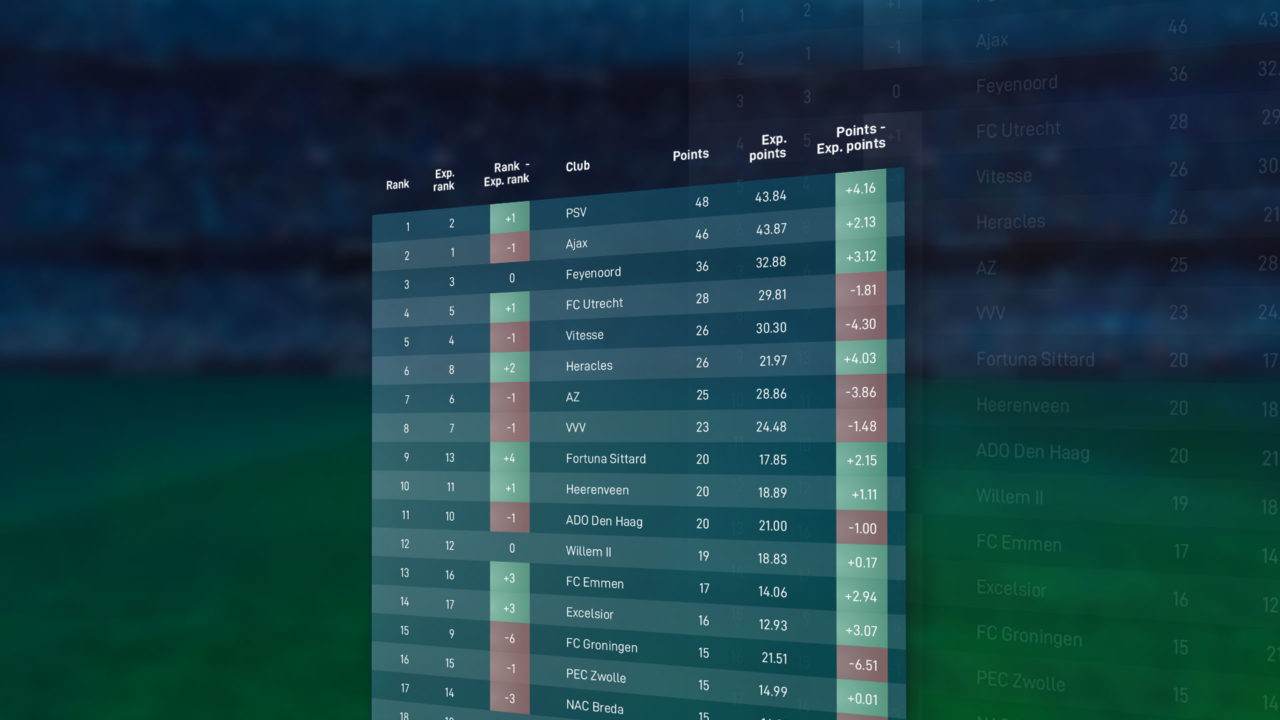
Figure 2. Eredivisie league table halfway the 2018-2019 season based on expected points rather than actual points.
Figure 2 shows the alternative league table for the Dutch Eredivisie halfway through the 2018-2019 season based on expected points. The final column shows the difference between the expected number of points and the actual number of points. For instance, FC Groningen earned 6.51 points fewer from their first 17 matches than they could have expected based on the courses of events in these matches. Vitesse (-4.30) and AZ Alkmaar (-3.06) also earned fewer points than they could have expected. Similarly, Ajax (+4.16), Heracles Almelo (+4.03), Feyenoord (+3.12) and Excelsior (+3.07) earned considerably more points than they could have expected from their matches.
Insights from our alternative league table based on expected points can help directors and managers to take better-informed decisions. With FC Groningen hovering just above the relegation zone halfway through the season, several media reported that their manager Danny Buijs was on the verge of being sacked. However, with Buijs still at the helm, FC Groningen eventually finished eighth, earning them a berth into the Europa League play-offs. Furthermore, by providing more insights into the true performances of football teams, our alternative league table can help sports gamblers identify interesting bets and journalists write more objective reports about teams and players.
Conclusion
Despite a plethora of possible applications, the task of estimating post-match win, loss and draw probabilities is virtually unexplored to date. The conventional approach of summing the expected-goals values for each team’s chances has a few clear limitations. To overcome these limitations, we introduce a deep learning approach that models the individual chances by each team and captures their temporal relationship. Our approach enables to produce an alternative league table based on expected points rather than actual points that provides more insights into the true performances of the teams.
This contribution is based on the research results Rogier Noordman obtained while working on his master’s thesis as an intern at SciSports. His master’s thesis is among the three finalists for the 2019 Football Science Groningen Award.